



Travel Derbyshire on Demand · 2024 to 2026
Road XS delivered the hardest brief in the programme.
Two vehicles, the largest area per vehicle of any government funded rural pilot in England, and two and a half years without a break.
A government funded on demand trial through Derbyshire’s Bus Service Improvement Plan, part of the Department for Transport’s National Bus Strategy, benchmarked here against the Department’s eighteen Rural Mobility Fund pilots.
What Road XS delivered, measured against the programme
The Department for Transport measured eighteen comparable rural pilots across England and published the results. Set the Road XS record beside them and six things stand out.
One scheme covered 232 square miles with five vehicles. Road XS covered 230 with only two.
Hertfordshire vs Travel Derbyshire on Demand
The DRT model usedFor the pilot, Road XS allocated journeys on a first come first served basis, in the order they arrived.Continuous fleet optimisation has since been added, reworking each vehicle’s run as bookings arrive so journeys are grouped in sequence rather than criss-crossing the area. Higher vehicle utilisation, and more bookable time slots for passengers.
A billion bus journeys lost since 2009
Before any of this is about software, it is about a country that has lost its buses.
House of Commons Transport Committee, Buses connecting communities, August 2025
In the smallest and most isolated communities, a traditional bus may not be the best way of meeting needs.
What the loss costs rural communities
A missing bus is not an inconvenience. It is a missed appointment, a job that cannot be reached, a week without seeing anybody.
The local picture explains the pattern.
One of the three districts in this operating area has some of the most challenging health indicators in Derbyshire, the lowest life expectancy in the county, and no acute or general hospital and no sixth form or further education provision of its own.
Residents travel out for all of it. Around 20% of the district population is 65 or over, projected to reach 24% by 2033.
Demand in this part of Derbyshire is therefore driven by access to health, education and services outside the district, rather than by commuting.
What Parliament has concluded about rural transport
In August 2025 the Transport Select Committee concluded that in the smallest and most isolated communities a traditional bus may not be the best way of meeting needs.
It recommended that decisions be made locally: where baseline connectivity comes from a timetabled service, and where it should come from alternative models such as demand responsive transport.
It went further. It recommended that within eighteen months the Department develops a dedicated policy and regulatory framework for demand responsive and community transport. Two items on its list are worth reading twice.
Read together, that is a select committee recommending that government help authorities get hold of booking and routing software, and that school transport, patient transport and social care transport start sharing the same capacity. Road XS already runs all of them in one platform.
Why the government funded pilots struggled
The UK Government had already tested the model at scale. Through the Rural Mobility Fund, the Department for Transport awarded £19.4 million to eighteen demand responsive pilots across rural and suburban England.
An independent evaluation of all eighteen was published in September 2025. It is the fullest public picture of what happens when public money is spent on this problem, and it is the benchmark every figure on this page is set against.
Those eighteen schemes reported 823,490 passenger journeys up to September 2024, which puts programme funding at roughly £23 a journey. Indicative rather than exact, since some schemes were still running and two had not launched.
Demand responsive transport is the right model for these communities, but delivering it has proved harder than funding it.
The published evaluations are candid about why, and most of the reasons sit with the software, the contracts and the data rather than with the model itself. Each one is worth reading against the record that follows.
House of Commons Transport Committee, Buses connecting communities, August 2025
Many demand responsive schemes have lasted only as long as their pilot funding, and no clear approach has emerged for sustaining these services once subsidies end.
- 01Commercial operation is difficult.Demand responsive transport was described in evidence by a major operator as really challenging.
- 02Awareness is a barrier.In one constituency survey, fewer than one in five people had heard of their local scheme.
- 03VAT distorts vehicle choice.The rules push authorities toward vehicles with ten or more seats, because fares on smaller vehicles attract VAT. Evidence to the Committee called this a regulatory issue blocking flexibility.
- 04The technology was mostly built elsewhere.Most companies involved in the government funded pilots operate globally, and their experience was largely outside the UK. The Department found that the scale and complexity of rural and suburban England was often new to them, and that this caused delays in setting schemes up.
- 05Payments were a sticking point.Authorities reported delays and frustration contracting with companies outside the UK over in app payment processing, because of unfamiliarity with UK public sector requirements around role designations and financial accountability.
- 06Contracts locked schemes in.Several authorities found themselves constrained by the specifications they had agreed with their technology providers.
- 07The data was not being collected.Passenger demographic data was not captured by most providers. Across eighteen pilots, one scheme could report passenger age.
National Audit Office, local bus services in England, June 2025
46% of authorities rated their own capacity to deliver local transport as fairly poor or very poor.
Nearly half the authorities responsible for this work have told an independent auditor they do not feel able to deliver it.
What Travel Derbyshire on Demand delivered with Road XS
- Ran Monday to Saturday with no fixed route, open to anyone, between any two points in the operating area.
- Built for residents who were not on a bus route, or who needed to reach places the network did not go.
Travel Derbyshire on Demand was funded by the government through Derbyshire’s Bus Service Improvement Plan, part of the Department for Transport’s National Bus Strategy.
It was a publicly funded trial of on demand transport, open to any resident of the three district areas.
The operating area spanned the whole of the Chesterfield, Bolsover and North East Derbyshire districts, roughly 285,000 residents and about 230 square miles.
The published service area listed 107 named towns and villages, from Chesterfield down to places with a few dozen households. That is the human version of the square mileage.
Road XS ran the whole scheme from launch on 21 February 2024: the app and telephone bookings, the matching, the stop registry, the driver runs and the reporting. One platform, two operators, no migration.

There is also an important piece of context behind these figures. The demand responsive capability in Road XS was built immediately before the national Covid lockdowns, and refined through a period when scheduled transport had largely stopped running.
It went live in Derbyshire without a comparable deployment behind it, on the largest area per vehicle in the peer group. This scheme was the first full test of the model at that scale.
7 ways Road XS ran things differently
The constraints the evaluation identified are mostly about rigidity: contracts that could not be varied, models that only worked one way, data that was never captured.
Set against each of those findings, this is what the same two vehicles were able to do.
Ranked by square miles covered per vehicle
No platform in the programme was asked to cover this much ground on so little
All eighteen Rural Mobility Fund pilots, from the Department for Transport’s published evaluation, with Travel Derbyshire on Demand placed alongside them. Programme average: 34 square miles per vehicle.
Square miles per vehicle, right hand column. Source: Rural Mobility Fund Phase 1 Evaluation, Department for Transport, September 2025, and the Road XS journey record for the scheme.
The largest population served by any of the eighteen pilots was 184,000, on four vehicles. Road XS served roughly 285,000 on two.
The 800 metre rule, and a stop network passengers built
The service had no fixed route. Road XS solved the coverage problem with one design decision.
Every stop carried an 800 metre catchment, about a ten minute walk at the very most, and more stops were added on request wherever it was safe to do so.
That one rule, set by the operator inside Road XS, turned a list of stops into continuous coverage of the whole operating area.
A circle of 800 metre radius covers 2.01 square kilometres. Covering 230 square miles with overlapping circles of that size takes somewhere around 360 well placed stops.
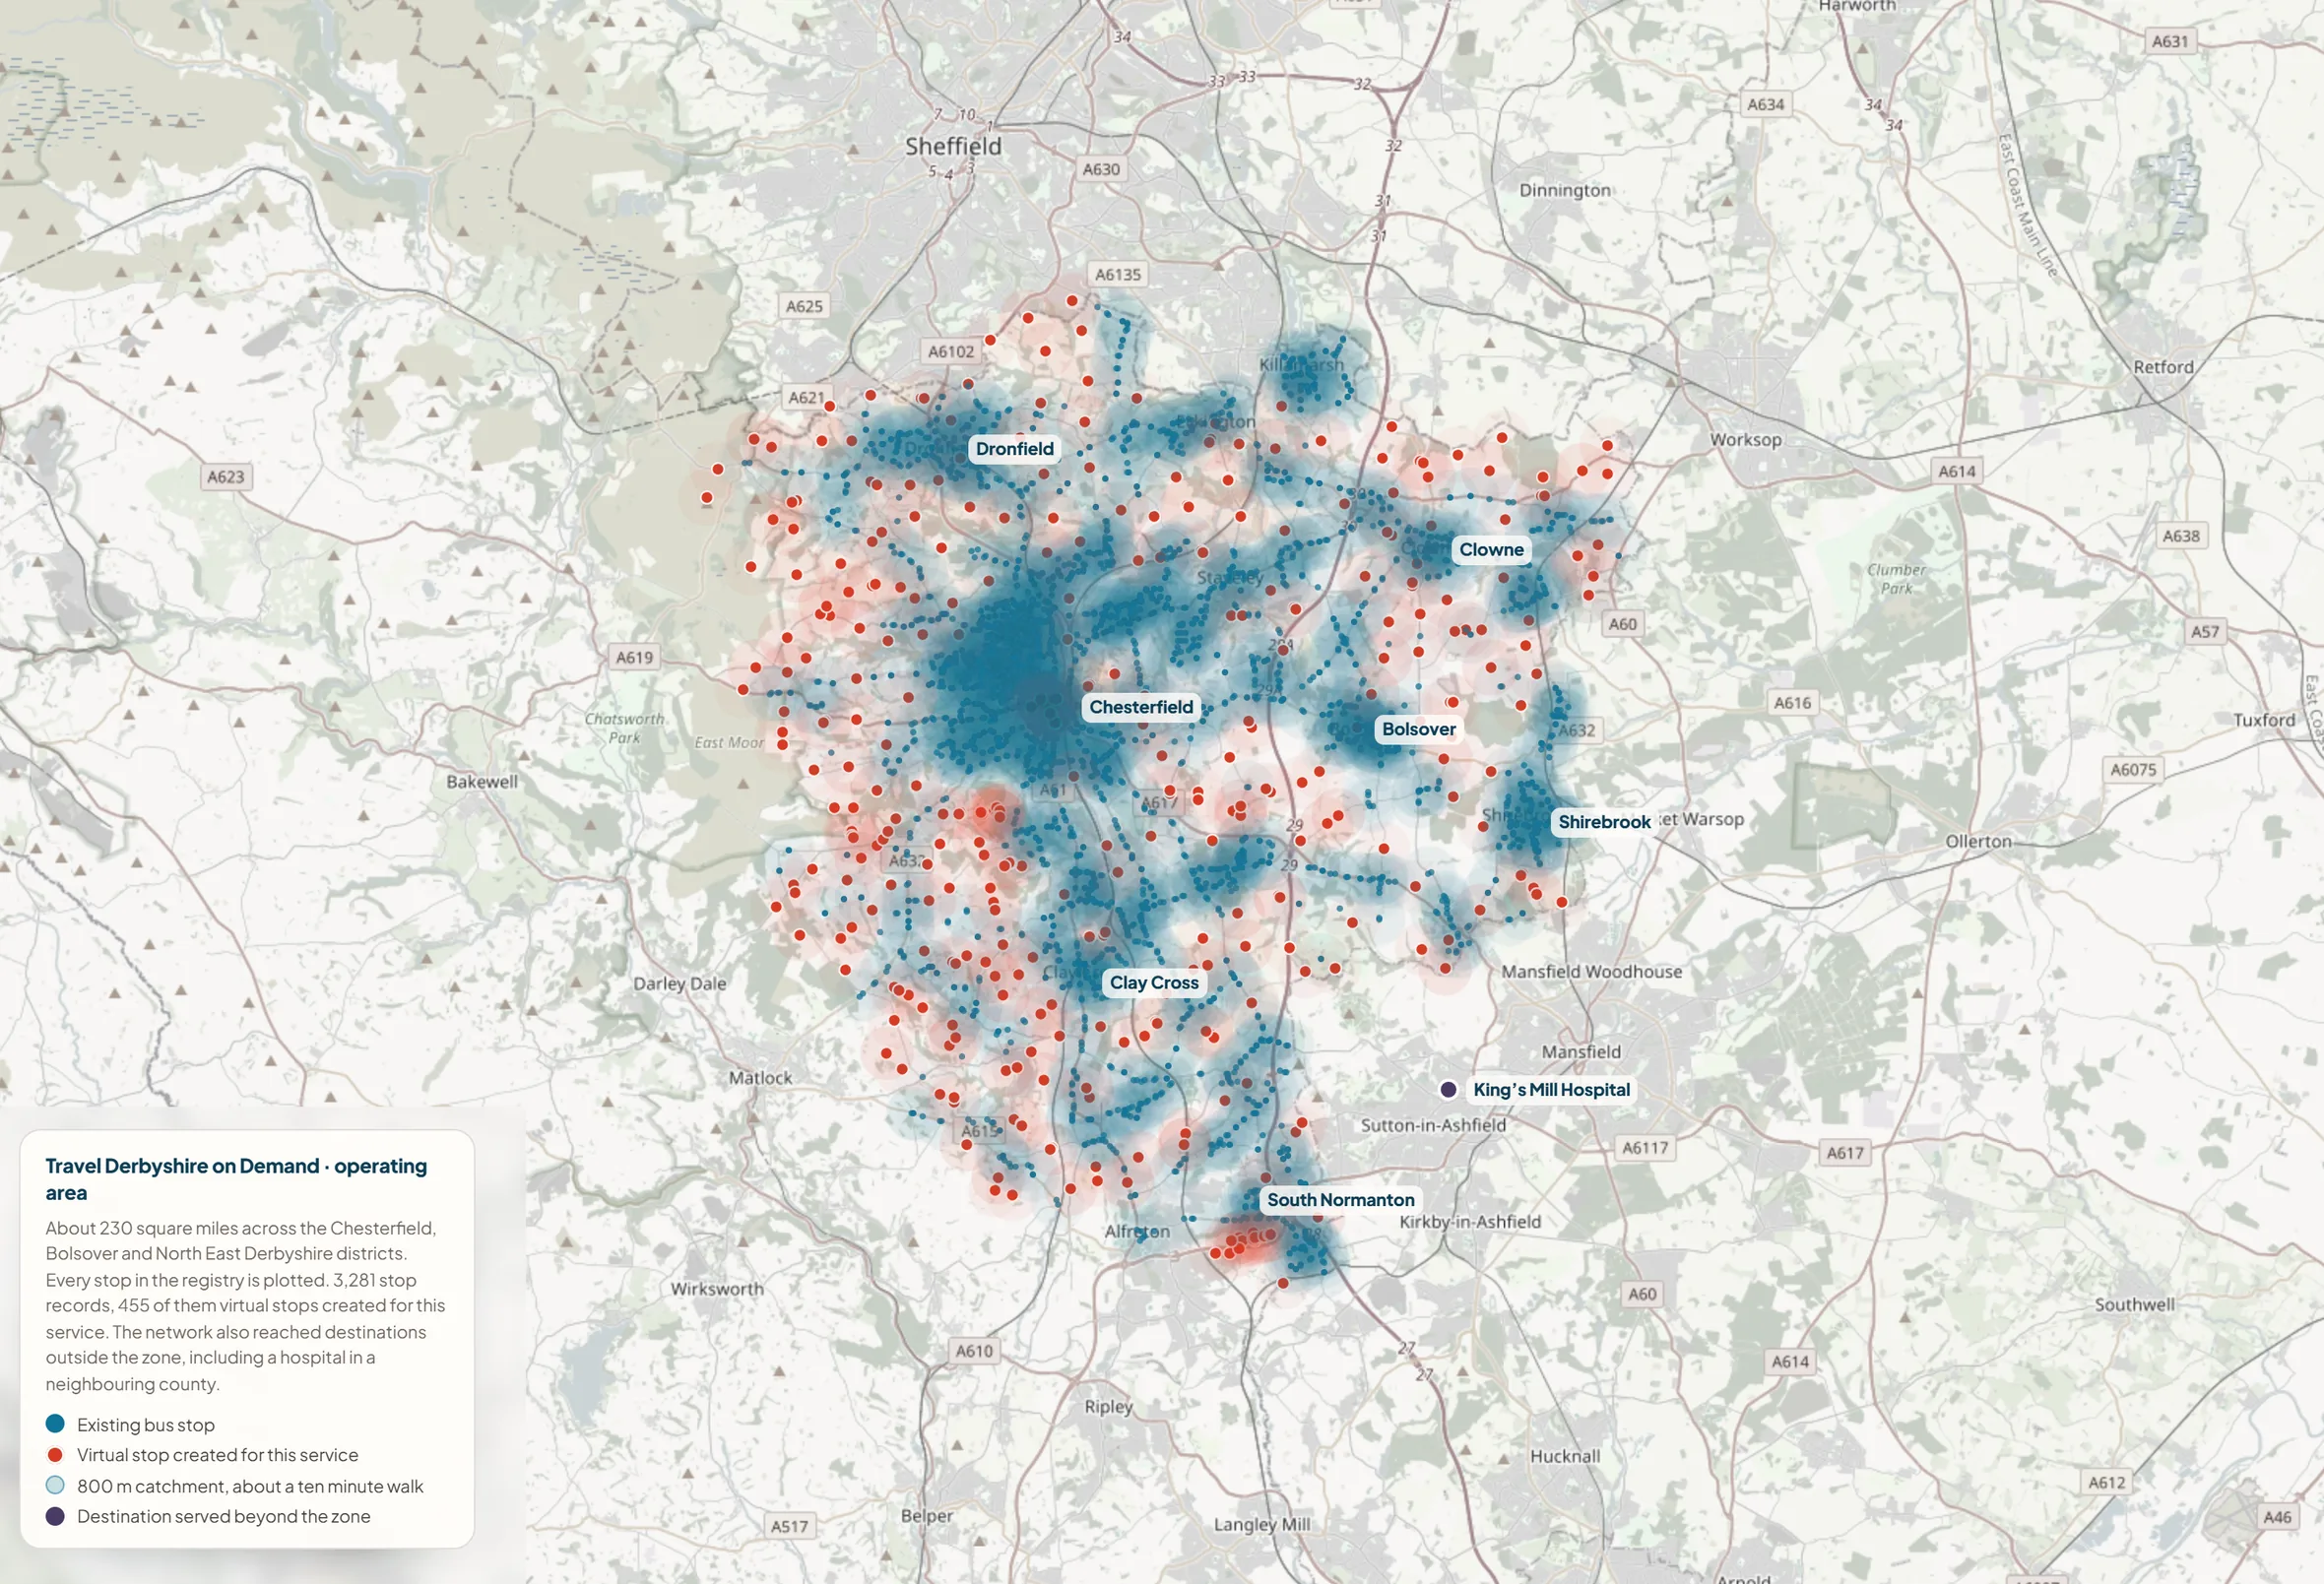
The registry held 3,281 stop records, including a separate entry for each direction of travel at physical stops. Collapsing the pairs that share a name within 60 metres of each other, the registry covered about 2,350 distinct boardable locations. Which is why the answer to “does it cover my area” was yes across all 107 named settlements.
Pickup points actually used, by days after launch
Every one of them exists because somebody asked to be collected there
773 is the count of stops passengers actually used. The registry held 3,281 records, which includes a separate entry per direction of travel at physical stops. 877 distinct what3words squares were used across the period.
The registry held two kinds of stop. Existing bus stops, which came with a road name. And 455 virtual stops created for this service, which came with a description instead. The descriptions are worth reading.
None of those were in any stop database. Somebody drove out, found a place a minibus could safely stop and a passenger could safely stand, and wrote down what was there so a driver would recognise it.
The Department’s evaluation names determining stop locations as one of the hard problems of scheme design, and records that several schemes cut the number of stops mid trial to shorten journey times. This scheme went the other way.
Rural Mobility Fund Phase 1 Evaluation, Department for Transport, September 2025
Nearly all the funded schemes ran a corner to corner model, picking up and dropping off at designated stops, in contrast to a door to door model that collects from a chosen address.
The registry for this scheme contained dozens of stops named explicitly as home pickups. Farms, barns, lodges, isolated houses, holiday lets, single properties reached down named lanes.
A public bus service with an app, virtual stops and a fare table, running door to door community transport pickups inside it for the passengers who could not get to a stop.
Both models, one service, one platform, the same two vehicles. Nearly every other scheme in the programme could only do one of them.
It also fed the national network: six rail stations, two bus stations, a coach station, motorway services and a hospital in a neighbouring county were all in the registry.
Rural demand has no rush hour
Every hour from 07:00 to 16:00 carried between 7.8% and 11.0% of all pickups. There was no peak worth designing a timetable around, and Road XS did not need one.
Share of all pickups, by hour
The profile was one of appointments spread across the working day rather than a commuter peak. A timetabled service sized for peak hours runs empty through the middle of a profile like this and turns passengers away at either end.
Demand responsive allocation is what let a two vehicle fleet work it.
Who travelled, and the data most providers missed
Rural Mobility Fund Phase 1 Evaluation, Department for Transport, September 2025
Passenger demographic data was not collected by most technology providers. The software was generating valuable data on journey needs, but not on the characteristics of the people making them.
Road XS reported all of it as standard, with no special data request:
Destination mix, excluding home pickups, across 5,693 legs
Across the eighteen pilots the most popular destination type was rail and bus stations, appearing 22 times among schemes’ top three destinations. Onward public transport at 13.3% here means the service fed the wider network rather than competing with it, while still doing a health led job.
There is a reason for that. Road XS came out of UK community transport. Wheelchair space, escorts, mobility notes and concessionary status were never features added later. They were the starting point, because you cannot dispatch a community transport vehicle without them.
App bookings, and 20 hours a week with no call centre
The service ran Monday to Friday from 7am to 7pm and Saturday from 8am to 5pm. The call centre ran Monday to Friday from 8am to 5pm and Saturday from 9am to 1pm. That was 69 service hours a week against 49 staffed hours.
For 20 hours every week, 29% of the time the buses were running, the app was the only way to book a journey at all.
Hours a week the service ran, against hours the call centre was staffed
The hatched section is the 20 hours a week, 29% of running time, when the Road XS app was the only way to book a journey.
The Road XS app did not replace the call centre. It extended booking access into the early mornings, the evenings and most of Saturday, when there was previously nothing.
In a passenger group where 28% held a concessionary pass and one journey in eight carried a wheelchair, that is an inclusion argument rather than a digital one.
The Department’s own evaluation concludes that maintaining a call centre for telephone bookings remains important for inclusion, and this service kept one open through the core of the day.
Continuity through a change of operator
The transport operator changed during the pilot. Road XS did not. Across 764 operating days there are only two interruptions of four days or more in the entire two and a half year period. One is a bank holiday weekend.
The other is the operator change, and it cost a single working day.
The day before the change carried a normal volume of bookings. The next operating day carried a normal volume of bookings.
Passenger records, accessibility flags, booking history and the whole stop network carried straight across. Nobody re registered. Nothing was rebuilt. The incoming operator started the service and ran it remotely, from outside the county.
Rural Mobility Fund Phase 1 Evaluation, Department for Transport, September 2025
Several authorities found themselves constrained by the contractual specifications agreed with their technology providers, and the knowledge of how to run a scheme tends to sit with one or two individuals.
Of everything it took to run this service, the software was the smallest line in the scheme.
Vehicles, drivers, the depot, fuel, insurance and the call centre all cost more, and every one of them changed hands when the operator did. The platform did not. The stop network, the passenger records, the accessibility flags and the booking history carried straight across.
Passenger records, the stop network and the booking history sat with the platform rather than the operator. That is what made the handover a one day event.
The hardest configuration in the programme
The Department’s evaluation is unambiguous about what drives performance in demand responsive transport, and both of its key findings point the same way.
Put those together and the design of this pilot becomes clear. One very large single zone, the largest area per vehicle in the programme, and the smallest fleet relative to the ground covered.
On the Department’s own model, that is the least favourable configuration available.
Road XS delivered two and a half unbroken years from it.
And it ran on first come first served allocation. Journeys were assigned in the order they arrived, with no continuous reoptimisation as the day filled up.
The passenger site says so publicly, in the answer to why a regular pickup time has moved: somebody booking earlier than usual could shift the time of somebody who had travelled at the same hour for months.
Every throughput figure on this page was produced without optimisation.
The record also makes the structural weakness of that model visible. A single booking placed early could commit a vehicle for part of the day and displace later requests, whatever those requests were for.
Allocation by arrival order treats a hospital appointment and a flexible shopping trip as equal claims on the same capacity. It cannot weigh one against the other, and it cannot group journeys that could reasonably travel together.
That is the case for optimisation rather than order of arrival. Grouping compatible journeys and prioritising by request type gets more out of the same two vehicles, and it widens the range of times a passenger can be offered.
Road XS also schedules to an arrival time. For medical appointments the platform works backwards from the time the passenger has to be there, factoring in the shared route so nobody arrives late for treatment.
On this scheme that option was open to every journey type. A shopping trip could be booked with the same fixed arrival constraint as a hospital appointment, even where the passenger had far more flexibility.
Reserving arrive by scheduling for appointment based journeys leaves the flexible trips free to be grouped, which is where the capacity gain sits. It is a configuration choice, and it belongs to the operator.
Boarding time is the other constraint the record exposes. Road XS holds a load time against each passenger, so a wheelchair boarding, an escort or a mobility aid is scheduled accurately rather than assumed.
That accuracy has a cost in capacity. Every minute added beyond the default is a minute the vehicle is not moving, and a minute another passenger cannot book.
Across two vehicles and 230 square miles, that arithmetic sets the ceiling on how many journeys a day can hold.
It also raises a question worth asking of any scheme. Some of the journeys recorded here would have been better matched to a community car scheme, or to a dedicated hospital transport service.
That would leave the demand responsive fleet for the journeys only it can do. Road XS makes the question answerable, because load time, journey purpose and destination are all recorded against the booking rather than inferred later.
Every figure in this record was produced from the least favourable configuration in the peer group.
Alternative times offered, and why they were declined
When a requested time was already committed, Road XS proposed the nearest time it could carry, and logged whether the passenger took it.
That record is worth reading carefully. A declined offer is not a journey the software could not find.
It is a passenger for whom the alternative did not work, sometimes as little as thirty minutes from the original request, even on a flexible trip such as shopping.
| Year | Offered | Accepted | Rejected | Acceptance |
|---|---|---|---|---|
| 2025 | 2,735 | 674 | 2,061 | 24.6% |
| 2026, to August | 1,758 | 611 | 1,147 | 34.8% |
In 2025 the service delivered 6,450 journeys and offered an alternative on 2,735 further occasions. Acceptance then improved by 41% in relative terms as Road XS got better at proposing times people could actually use.
Share of offered alternative times that passengers accepted
Acceptance improved by 41% in relative terms as Road XS got better at proposing times passengers could actually use.
Read alongside the Department’s model, which puts each additional vehicle at roughly 754 more journeys a month, that record gives an authority something no timetable produces: evidence of where two vehicles ran out of room, and evidence of how far passengers were and were not willing to move.
Road XS logged all 3,208 declined offers. A timetabled service produces no equivalent data.
Some of that rigidity is a booking model rather than a passenger preference.
Road XS books a return as a single journey, working out the outbound and the return leg together, so the scheduler can see the whole shape of a passenger’s day and hold room for the way home.
Platforms across the programme took single bookings only, which leaves the passenger to book twice and the scheduler with half the picture.
Fares, modelled revenue and value
The Department reports revenue per passenger journey across the eighteen pilots at £0.86 to £5.22, averaging £2.01.
Converting this scheme’s published fare table to the same basis, with a return counting as two passenger journeys, it sat between £1.80 and £4.00 per paid journey depending on ticket type: the common adult return at £3.50, the ten trip ticket at £3.00.
Applying the observed 28.1% concessionary share, which generates no fare revenue at all, the blended figure lands somewhere around £2.20 to £2.50.
The point sits underneath the arithmetic. This scheme carried the highest cost and lowest revenue passengers by design. 28.1% travelled free. 12.3% needed a wheelchair space.
The largest destination category was health and care, in a district with no acute hospital and no sixth form of its own.
Those are exactly the journeys a commercial operator will not run and a fixed timetable cannot reach, and Road XS was built to make sure they happened anyway.
When administrators were appointed, invoices went unpaid. The service kept running.
The service continued to operate throughout, and passengers were unaffected.
What the pilot taught, and what is in Road XS now
The evaluation names the unsolved problem of the whole programme, and names it more than once. Passenger aggregation.
The levers authorities reached for were all manual service design changes: splitting travel zones, cutting the number of available stops, widening pickup windows from ten minutes to twenty, introducing group tickets. Blunt instruments, applied by hand, months after launch.
Four things have come out of this pilot. Each one answers something a government report identified.
The pilot allocated journeys in the order they were requested. Road XS is being upgraded to keep optimising the day as it builds, so throughput improves as bookings arrive rather than being fixed by arrival order.
Answers a named finding. Passenger aggregation is the problem the Department’s evaluation leaves open across all eighteen schemes. This solves it in the algorithm rather than by redrawing zones after the fact.
Road XS now runs smaller zone services, demonstrated through 2026 and into 2027 on a service picked up after a local transport scheme collapsed.
The technology proved more efficient in the tighter geography, and the Derbyshire record proves it also scales to the largest area per vehicle in the peer group. Most platforms are optimised for one or the other.
Answers a named finding. The evaluation is clear that smaller service areas produce more journeys per vehicle hour and less empty running, which is why several authorities split their zones mid trial.
Zoning, vehicle allocation, routing and journey scheduling, booking windows, stop management. Road XS puts those settings in the operator’s hands rather than the vendor’s.
We provide the technology; all you need are vehicles and drivers, and once you have set your own rules you can activate the service. The Derbyshire handover is what that sentence looks like in practice.
Answers a named finding. The evaluation lists exactly those settings as things authorities wanted control over and could not always get.
Speed, direction and position captured in real time, and the actual route recorded against the estimated one. It closes the one measurement gap in this whole record.
Dead miles were not captured during the pilot, and every run in the export reads zero. Actual route capture makes them fall out of the data rather than depending on a driver writing a number down.
Answers a named finding. Empty running is the metric the sector is judged on. The Department publishes it for all eighteen schemes, at a mean of 0.77 and a range of 0.45 to 1.09. The first scheme running the new tracking has a published benchmark to be measured against from day one.
This is the start of that work, not the end of it. Road XS is built in the UK and came out of UK community transport, which is why wheelchair space, escorts, mobility notes and concessionary status were the starting point rather than a later addition.
The Community Transport Association told the Select Committee that demand responsive transport is not new, and that the sector has been delivering it for over sixty years. What is new is the digital technology.
Four lessons for running demand responsive transport
Read as a piece of service design rather than a case study, the Derbyshire record settles four questions that come up whenever an authority plans a demand responsive service.
The verified record, February 2024 to August 2026
Sources and licensing
- 1Transport Committee, Buses connecting communities, Third Report of Session 2024 to 2025, published 13 August 2025.
https://publications.parliament.uk/pa/cm5901/cmselect/cmtrans/494/report.html - 2Chatterjee, K., Beyazit, E. and Shergold, I. (2025). Rural Mobility Fund Phase 1 Evaluation: Final Report. Report to the Department for Transport, produced by the University of the West of England, September 2025.
https://www.gov.uk/government/publications/rural-mobility-fund-phase-1-evaluation-final-report - 3National Audit Office, report on local bus services in England, June 2025, cited in source one.
- 4County Councils Network, June 2025, cited in source one.
- 5Travel Derbyshire on Demand published service and fare pages, and the Road XS journey record for the scheme, 21 February 2024 to 29 August 2026.
Contains public sector information licensed under the Open Government Licence v3.0. No operator is named on this page, and no passenger or driver is identifiable. Service design, fares and operating area detail are drawn from the scheme’s own published passenger information.